- not so Frequently Asked Questions -
update 2004/8/31
|
|
- not so Frequently Asked Questions - update 2004/8/31
|
Introduction to gnuplot --- Life with it It's working !
(Anakin, Tatooine) Make a Batch ProcessHere we explain how to finish your graph which was prepared as described before. A plot-file "output.plt" is a saved file at the last part of "Numerical Calculations" section. This file contains parameters and functions, some of those are default ones while the other part is defined by user. In the following list we eliminated the default lines, and "set terminal" and "plot" lines are folded. #!/usr/local/bin/gnuplot -persist # set terminal postscript landscape noenhanced monochrome \ # dashed defaultplex "Helvetica" 14 # set output 'output.ps' set xlabel "x" 0.000000,0.000000 "" set ylabel "y=exp(-x)" 0.000000,0.000000 "" set title "Pade approximation" 0.000000,0.000000 "" set xrange [ 0 : 2 ] noreverse nowriteback set yrange [ 0 : 1 ] noreverse nowriteback set mxtics 5.000000 set mytics 5.000000 set xtics border mirror norotate 1 set ytics border mirror norotate 0.5 plot "output.dat" using 1:2 title "Analytical" w l, \ "output.dat" using 1:3 title "L=1, M=2" w l, \ "output.dat" using 1:4 title "L=2, M=1" w l # EOF At the top of this file you may see the part where an output device (Postscript) and file-name are defined. You can draw the same graph with this file by using the load command. When you make another calculation, and the result is stored in "output.dat", you can reused this plot-file for the new plotting. gnuplot> load "output.plt" Alternatively, you can give this file name as a command-line option when gnuplot is invoked. In this way gnuplot exits after the last line of the file is read. A graph on your screen disappears at the same time. To keep the graph on your screen, insert pause -1 at the end of this file. The graph stays there till you hit a 'return' key. % gnuplot output.plt A command-line option -persist also keeps the graph on your screen. With this method, gnuplot itself exits but the graph window settles down. % gnuplot -persist output.plt As can be see at the first line of the plot-file, this option is already included as a shell script option. This option can be used by giving permission of execution to this file, as follows. % chmod +x output.plt % ./output.plt With this manner you have to close the window every time. You can continue your work interactively at the gnuplot command-line once the plot-file is loaded. However, a batch-mode is more convenient. Firstly, insert pause -1 at the end of the file, then
Repeat this sequence until you get a satisfactory figure. If you are aiming at a Postscript file, your sequence may become:
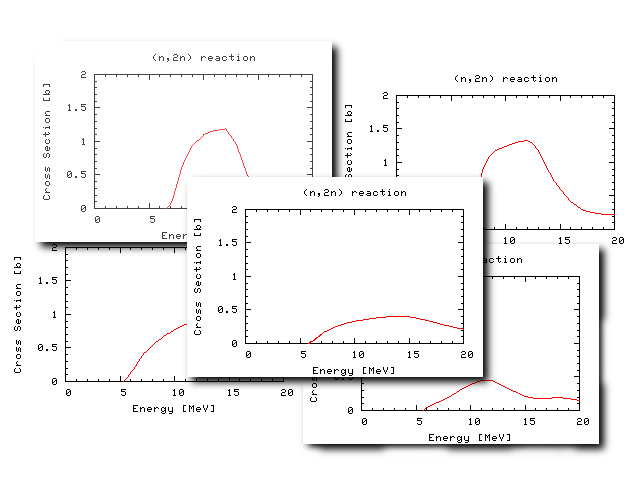
In this case, a comment sign '#' at the beginning of set terminal postscript and set output 'output.ps' lines should be deleted. You don't need pause because no drawing appears on your screen.  Draw Many FiguresOne nice thing to use gnuplot in your scientific activity is that we can reuse the plot-file to make a similar figure. We often draw very similar figures those have same axis names, same ranges, etc. but the numerical data inside the graph are different. With gnuplot you can do this by using only one plot-file. To do it, change the data file name at plot "datafile" or use the same data file name but the file is overridden by various data. Gnuplot batch mode is very useful when you want to make a large number of figures at one time. If you are doing this with something another software, you have to struggle with your computer until midnight. Why don't you make your life easier with gnuplot and some UNIX commands to generate many figures within a few seconds. Here we think about a case that you have many data files --- calc1.dat, calc2.dat, calc3.dat --- in your directory, and each file contains simple (X,Y) data. Firstly, we make a graph of the data file, calc1.dat . Here we define the figure title, name of axes, X and Y ranges, and graduations, just like we have done in the numerical calculation section. set terminal png set output "calc1.png" set xlabel "Energy [MeV]" set ylabel "Cross Section [b]" set title "(n,2n) reaction" set xrange [ 0 : 20 ] set yrange [ 0 : 2 ] set mxtics 5 set mytics 5 set xtics 5 set ytics 0.5 plot "calc1.dat" using 1:2 notitle w l A PNG image file is generated by gnuplot, when you "feed" this data.plt file to gnuplot. If you need an EPS file, use set terminal postscript , and change the name of output file properly, like calc1.eps. % gnuplot < data.plt 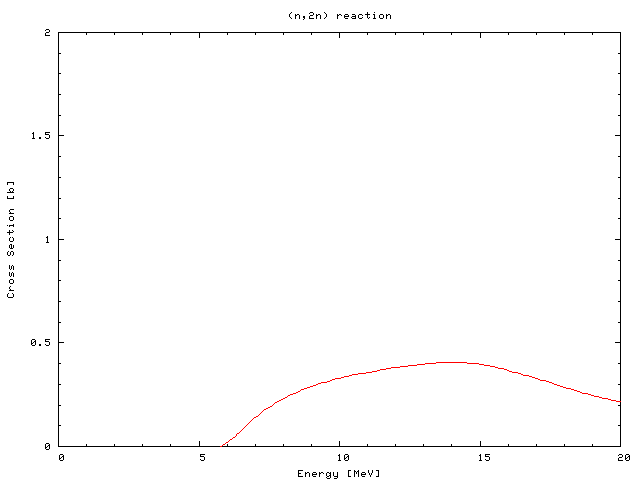 Now we reuse this to make a figure of another data file. To do it, we have to rewrite the file names "calc1.dat" and "calc1.png" in that file. Unfortunately you cannot use strings-type data in a gnuplot command, we replace the text "calc1" into "calc2" with the UNIX command, sed. Alternatively, those file names are give as command line options of a shell script. The following command changes the text "calc1" in a file into "calc2". % sed "s/calc1/calc2/g" data.plt | gnuplot This one-line command makes a new figure, calc2.png. You repeat this for all your data files. When the number of data is not so large, you can use a shell-loop ('foreach' of csh, or 'for' of sh). csh, tcsh % foreach i (calc2 calc3 calc4 cal5) foreach? sed "s/calc1/$i/g" data.plt | gnuplot foreach? end sh, bash $ for i in calc2 calc3 calc4 cal5 ; do > sed "s/calc1/$i/g" data.plt | gnuplot > done When you have many files, you can remove the extension '.dat' of the file name with sed like below. Be careful that there are quotation and back-quotation marks. The inside sed command is to remove '.dat' extention of the variable $i , and the outside is to convert the strings "calc1." $ for i in *.dat ; do > sed "s/calc1/`echo $i | sed "s/\.dat$//"`/g" data.plt | gnuplot > done You can also make a shell script to draw figures one-by-one. Once you make such a script, you can reuse this for other jobs. The script contains many lines corresponding to the number of your data files. #!/bin/sh sed "s/calc1/calc2/g" data.plt | gnuplot sed "s/calc1/calc3/g" data.plt | gnuplot sed "s/calc1/calc4/g" data.plt | gnuplot sed "s/calc1/calc5/g" data.plt | gnuplot ... To make this you can use the UNIX commands, 'ls' and 'awk'. The following one-line command shows you the list of commands with which you can make many figures at one time. To make a shell-script file, re-direct this output to a file ( command > script.sh ).
% ls *.dat | awk '{printf("sed \"s/calc1/%s/g\" data.plt | gnuplot\n",$1)}'
You can write gnuplot commands directly in a shell script, and your file name is given as a command line option. To do this, use a "here document" of the UNIX shells. In this example, we make an EPS file "calc1.eps" from the data file "calc1.dat." #!/bin/sh gnuplot << EOF set terminal postscript eps color enhanced set output "$1.eps" set xlabel "Energy [MeV]" set ylabel "Cross Section [b]" set title "(n,2n) reaction" set xrange [ 0 : 20 ] set yrange [ 0 : 2 ] set mxtics 5 set mytics 5 set xtics 5 set ytics 0.5 plot "$1.dat" using 1:2 notitle w l EOF As you can see in the example above, the names of data and EPS files (without extensions) are replaced by a variable $1. The real names of those variables are given as the command line option to this shell script plot.sh. This script makes the EPS file "calc1.eps" from the data file "calc1.dat" when the command is invoked like below. With this method you can make a figure of your data files which are in a different directory, and the result is stored in the same directory. $ ./plot.sh calc1 To change the names of data file and EPS, you replace one of the $1 variables in the script above into $2, and give two command line options to this script. Finally the next shell script makes it possible to generate many figures within a second. #!/bin/sh ./plot.sh calc1 ./plot.sh calc2 ./plot.sh calc3 ./plot.sh calc4 ... from Dr. Sato. Thanks !
 |