- not so Frequently Asked Questions -
update 2004/9/5
|
|
- not so Frequently Asked Questions - update 2004/9/5
|
|
not so FAQ |
About 2-Dimensional Plot (No.4)I want to draw two axes in the different scale.Sometimes one wants to make two axes in one figure --- for example, the X-axis is a temperature which is represented by both Celsius (C) and absolute (K). There are several ways to do it, for example, display two figures by multiplot, or use the opposite axis. Here is an example of use of multiplot. Let's make two X-axes. At first, make the figure height smaller, set the bottom margin zero, then enter the multiplot mode. gnuplot> set size 1.0,0.7 gnuplot> set bmargin 0 gnuplot> set yrange [0:5] gnuplot> set multiplot Raise the figure slightly, and plot the first graph. In a following example we draw a function y=exp(x)-1. The unit of x is "minutes". multiplot> set origin 0,0.3 multiplot> set xrange [0:2] multiplot> set xtics 1 multiplot> set xlabel "Time [min]" multiplot> plot exp(x)-1 notitle Now, lower the figure, and draw the X-axis only. To avoid overlapping, adjust tics by set noytics , set xtics nomirror . Finally, plot a function which does not fit to the current drawing (I mean, it is outside the graph). In this example it was y= -1 multiplot> set origin 0,0.15 multiplot> set xrange [0:120] multiplot> set xtics nomirror 30 multiplot> set noytics multiplot> set xlabel "Time [sec]" multiplot> set border 1 multiplot> plot -1 notitle multiplot> set nomultiplot gnuplot> 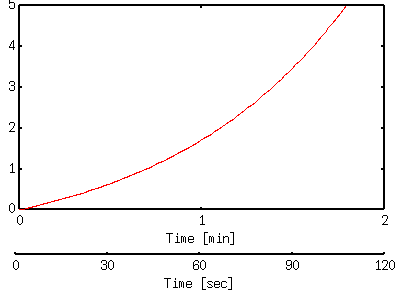
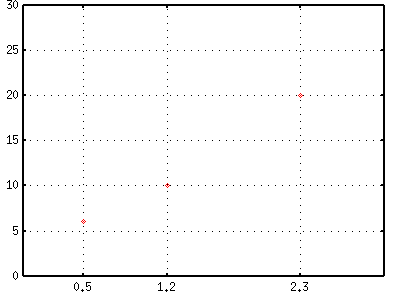
Well... probable there are more elegant ways to do it than this example, but practically it is no problem. It is not easy to adjust precisely the distance between two X-axes. To make it easier, add a new axis with other drawing programs other than gnuplot such as Tgif.  I want to make grid at an arbitrary position.The command set grid makes grid lines at the major tics positions, and those are equidistant usually. To make the grid at an arbitrary position, adjust the major tics position by the command set tics . In the following example, three tics are displayed at 0.5, 1.2, and 2.5 by the set xtics command.
gnuplot> set xtics ("0.5" 0.5, "1.2" 1.2, "2.3" 2.3)
gnuplot> set grid
 In order to make the arbitrary grid keeping the tic position equidistant, use the opposite axis. Choose the grid positions by set x2tics , then make the grid according to the X2 axis by set grid command option.
gnuplot> set xtics 0,1
gnuplot> set x2tics ("0.5" 0.5, "1.2" 1.2, "2.3" 2.3)
gnuplot> set grid noxtics x2tics
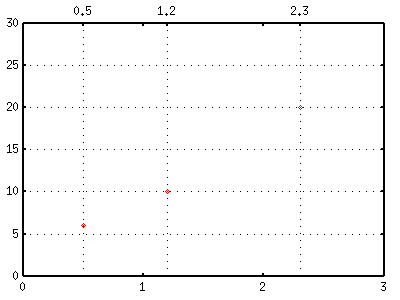 If you want to remove numbers at the top of this figure, set x2tics "" 0.5 . Those numbers disappear but X2 major tics still remain. |