- not so Frequently Asked Questions -
update 2004/12/14
|
|
- not so Frequently Asked Questions - update 2004/12/14
|
|
not so FAQ |
2次元プロットのあれこれ (その5)図の中に図を描きたいグラフ中の空いた部分に,別の小さな図を描いてみましょう.よくあるの は,図の込み入った部分の拡大図を作るものです.複数の図を同時に描くので, ここではmultiplotを使います.全体の図の サイズを1としたときに,図中の図の縦横を0.5にしたものを作ります. multiplotに入った後,まず全体の図を描きます. gnuplot> set xrange [ 0 : 20 ] gnuplot> set yrange [ 0 : 6 ] gnuplot> set xtics 5 gnuplot> set ytics 1 gnuplot> set multiplot multiplot> set origin 0.0,0.0 multiplot> set size 1.0,1.0 multiplot> plot "file.dat" u 1:2:3 notitle with yerrorbars,\ > "file.cal" u 1:2 notitle with lines 図の原点を空いた部分(0.45,0.1)に移動した後,縮小したグラフを描きます. XとYのレンジは,拡大したい部分を指定します.拡大窓にプロットするの は,レンジが違う以外は上の全体のものと同じですので,replot を使うことができます. multiplot> set origin 0.45,0.1 multiplot> set size 0.5,0.5 multiplot> set xrange [ 1 : 5 ] multiplot> set yrange [ 2.4 : 3.0 ] multiplot> set ytics 0.5 multiplot> replot multiplot> set nomultiplot gnuplot> 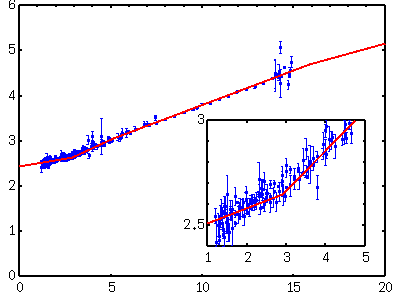
Xの小さい部分が拡大されて見やすくなっていませんか.ここでは,拡大 窓の位置をうまく設定して,両方の図が重ならないようにしていますが,全体 図中の線や点が拡大図の中に入ってしまうと,両者は重なって表示されてしま います.gnuplotで,このような部分を消すことはできません. 軸名を入れる場合は全体の図だけにしておき,小さい方の図には付けないほ うが良いでしょう.また,全体を縮小するEPSを作る場合は,全体の大きさ を決めるset size は multiplotモードに入る前に定義しないと いけません.multiplotに入った後でサイズを定義しても,Postscriptファ イルに書き込まれるBoundingBoxは画面全体になってしまいます.完成品が ぷろっとぎゃらりぃ にありますので参 考にしてください.  簡単な棒グラフ.スタイル一覧にあるように, gnuplotが描く棒グラフ with boxes は中空の矩形になります.内 部の塗りつぶしはver.3.6以前のgnuplotはできませんが,ver.3.8から可能に なりました. Postscriptに出力するなら,非常に太い線を使って with implusesで描くのが簡単です.下の例では,1番の線種の幅を50倍に しています. gnuplot> set term postscript eps enhanced color gnuplot> set linestyle 1 lt 1 lw 50 gnuplot> # for gnuplot ver.4 gnuplot> # set style line 1 lt 1 lw 50 gnuplot> plot "test.dat" using 1:2 with imp ls 1 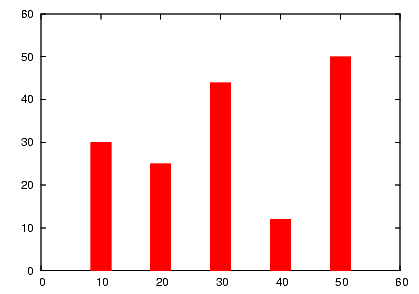
[ver.4] ONLY ! Ver.4以降では,box styleでの矩形を塗りつぶすオプションが追加されてい ます. with boxes に fs [pattern | solid] (fillstyle)のオプションを付けて作画します. set style fill を用いて,塗りつぶすパターンを別に設定することもできます. with boxes fs pattern の場合は,使用するパターンを番号で 指定します. solid の場合は,0から1までの塗りつぶしの濃さを 指定します. 下の例では,棒の幅は3とし,これを(3)で与えています. gnuplot> plot "test.dat" usi 1:2:(3) w boxes fs pattern 1,\ gnuplot> "test.dat" usi ($1+5):2:(3) w boxes fs solid 0.7 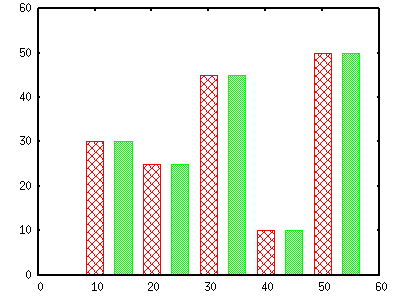
|