gnuplot / postproc
| not so FAQ
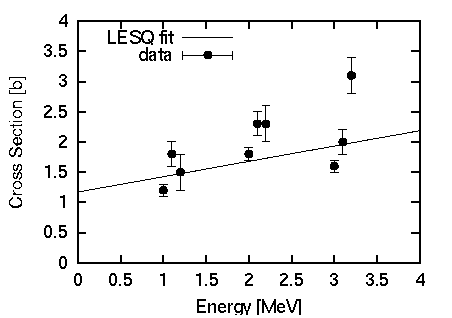
| 図を描いたその後は...(その1)作ったグラフをTeXの文書に貼り込みたい. gnuplotのドライバにはlatexというのがあり,これを使えばグラフを まず,gnuplotで図をプロットし,出力ドライバをenhanced EPSにして, gnuplot> set term postscript eps enhanced gnuplot> set output "test.eps" gnuplot> set key left top gnuplot> set size 0.5,0.5 gnuplot> set xrange [0:4] gnuplot> set yrange [0:4] gnuplot> set xlabel "Energy [MeV]" gnuplot> set ylabel "Cross Section [b]" gnuplot> set linestyle 1 lt 1 gnuplot> set linestyle 2 lt 1 pt 7 gnuplot> # for gnuplot ver.4 gnuplot> # set style line 1 lt 1 gnuplot> # set style line 2 lt 1 pt 7 gnuplot> plot 0.2536*x+1.1717 title "LESQ fit" > with lines linestyle 1, > "test.dat" usi 1:2:3 title "data" > with yerrorbars linestyle 2
標準のままでEPSを作ると,図に比べて文字が小さくなりすぎてしまいま 誤差棒付きの記号を描く場合,gnuplotのPostScriptドライバは,線種を1以 TeX(LaTeX2e)に図を貼り込むには,graphicsパッケージを使います.図を任 documentclass{article} usepackage{graphics} begin{document} begin{figure} begin{center} resizebox{120mm}{!}{includegraphics{test.eps}} caption{This is a sample figure.} label{test} end{center} end{figure} end{document} 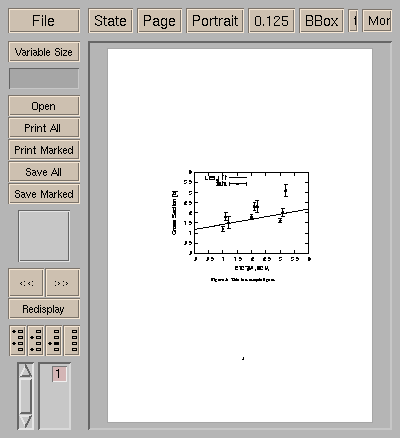  複数の図をまとめて一つにしたい. 複数の図をまとめるには,gnuplot の multiplotを使う方法や複数のEPS 2行2列の計 4枚の図を配置する場合を考えましょう.Y軸のラベルは, まず,4つそれぞれの図のEPSファイルを作っておきます.このとき, gnuplot> set term postscript eps enhanced gnuplot> set lmargin 5 gnuplot> set bmargin 3 gnuplot> set rmargin 2 gnuplot> set tmargin 2 gnuplot> set size 0.5,0.5 gnuplot> set xrange [0:2*pi] gnuplot> set yrange [-1:1] gnuplot> set output "test1.eps" gnuplot> set xlabel "" gnuplot> set ylabel "sin x" gnuplot> plot sin(x) notitle gnuplot> set output "test2.eps" gnuplot> set xlabel "" gnuplot> set ylabel "" gnuplot> plot sin(2*x) notitle gnuplot> set output "test3.eps" gnuplot> set xlabel "X [nodim.]" gnuplot> set ylabel "cos x" gnuplot> plot cos(x) notitle gnuplot> set output "test4.eps" gnuplot> set xlabel "X [nodim.]" gnuplot> set ylabel "" gnuplot> plot cos(2*x) notitle これらtabular環境に取り込んで,整列させます. documentclass{article} usepackage{graphics} begin{document} begin{figure} begin{center} begin{tabular}{cc} resizebox{60mm}{!}{includegraphics{test1.eps}} & resizebox{60mm}{!}{includegraphics{test2.eps}} \ resizebox{60mm}{!}{includegraphics{test3.eps}} & resizebox{60mm}{!}{includegraphics{test4.eps}} \ end{tabular} caption{This is sample figures.} label{test4} end{center} end{figure} end{document} 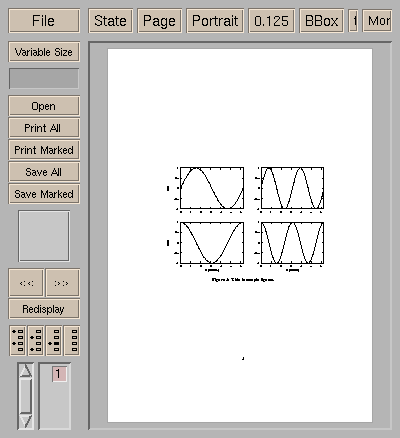 figure環境にせず,単純にtabularで配置した後,そのページだけをdvipsで この他にも,tgifを使って,複数のプロットを一つにまとめる方法もあり |