gnuplot / postproc (E)
|
not so FAQ |
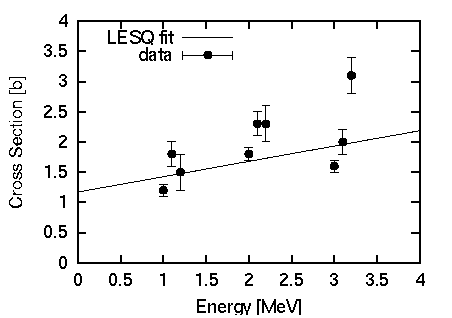
After Plotting (No.1)I want to put a figure in my TeX document. Gnuplot has a latex terminal which is capable of generating a Firstly, make a figure with gnuplot, and use the enhanced EPS terminal to gnuplot> set term postscript eps enhanced gnuplot> set output "test.eps" gnuplot> set key left top gnuplot> set size 0.5,0.5 gnuplot> set xrange [0:4] gnuplot> set yrange [0:4] gnuplot> set xlabel "Energy [MeV]" gnuplot> set ylabel "Cross Section [b]" gnuplot> set linestyle 1 lt 1 gnuplot> set linestyle 2 lt 1 pt 7 gnuplot> # for gnuplot ver.4 gnuplot> # set style line 1 lt 1 gnuplot> # set style line 2 lt 1 pt 7 gnuplot> plot 0.2536*x+1.1717 title "LESQ fit" > with lines linestyle 1, > "test.dat" usi 1:2:3 title "data" > with yerrorbars linestyle 2
If you don’t change the figure size, letters in the generated EPS When symbols in your figure have error bars, the PostScript driver To paste a graph in your TeX(LaTeX2e) document, use graphics
documentclass{article}
usepackage{graphics}
begin{document}
begin{figure}
begin{center}
resizebox{120mm}{!}{includegraphics{test.eps}}
caption{This is a sample figure.}
label{test}
end{center}
end{figure}
end{document}
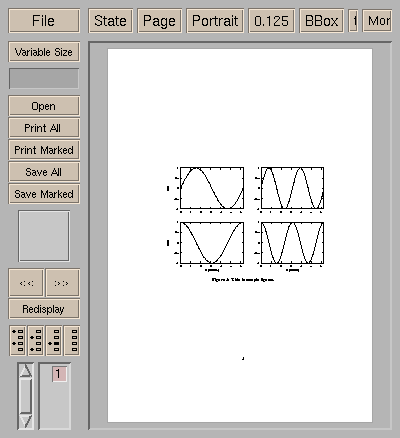
  I want to merge several figures into one figure. There are several ways to merge some figures, for example, use When you have 4 figures, and those are aligned into 2×2 matrix. Firstly, those 4 figures are prepared by 4 different EPS files. gnuplot> set term postscript eps enhanced gnuplot> set lmargin 5 gnuplot> set bmargin 3 gnuplot> set rmargin 2 gnuplot> set tmargin 2 gnuplot> set size 0.5,0.5 gnuplot> set xrange [0:2*pi] gnuplot> set yrange [-1:1] gnuplot> set output "test1.eps" gnuplot> set xlabel "" gnuplot> set ylabel "sin x" gnuplot> plot sin(x) notitle gnuplot> set output "test2.eps" gnuplot> set xlabel "" gnuplot> set ylabel "" gnuplot> plot sin(2*x) notitle gnuplot> set output "test3.eps" gnuplot> set xlabel "X [nodim.]" gnuplot> set ylabel "cos x" gnuplot> plot cos(x) notitle gnuplot> set output "test4.eps" gnuplot> set xlabel "X [nodim.]" gnuplot> set ylabel "" gnuplot> plot cos(2*x) notitle Those EPS figures are inserted into the tabular environment,
documentclass{article}
usepackage{graphics}
begin{document}
begin{figure}
begin{center}
begin{tabular}{cc}
resizebox{60mm}{!}{includegraphics{test1.eps}} &
resizebox{60mm}{!}{includegraphics{test2.eps}} \
resizebox{60mm}{!}{includegraphics{test3.eps}} &
resizebox{60mm}{!}{includegraphics{test4.eps}} \
end{tabular}
caption{This is sample figures.}
label{test4}
end{center}
end{figure}
end{document}
 If you want to make one PS file which contains several figures, Of course the same thing you can do with a drawing tools |