- not so Frequently Asked Questions -
update 2004/9/16
|
|
- not so Frequently Asked Questions - update 2004/9/16
|
|
not so FAQ |
Miscellaneous Stuff (No.1)Ternary operator (A ? B : C)The ternary operator works just the same as that in C-language. The ternary operator is expressed by A ? B : C. Firstly A is evaluated, if it is true (non-zero) B is executed; otherwise C is executed. The next example is a graph which is incontinuous at x=0, y=exp(-x) for x>0, and y=exp(4*x) for x<=0. gnuplot> set xrange [-5:5] gnuplot> plot x>0 ? exp(-x) : exp(4*x) 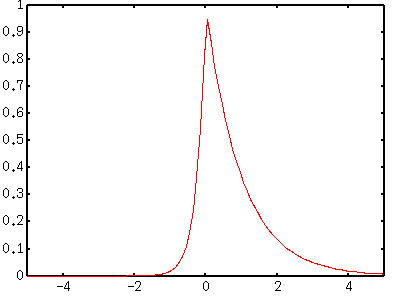 More complicated functions can be definced with this ternary operator. Here is an example of user-defined function which varies discontinuously along with the X values. gnuplot> f(x)= (abs(x)<1) ? 100 : ( (abs(x)<2) ? 50 : ((abs(x)<3) ? 20: 10 )) gnuplot> set xrange [-5:5] gnuplot> set yrange [0:150] gnuplot> set sample 1000 gnuplot> plot f(x) 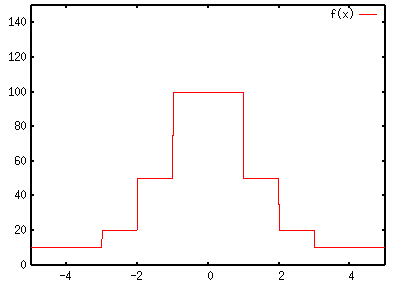
This function gives 100 if the absolute value of X is less than 1, 50 for 1<=|X|<2, 20 for 2<=|X|<3, and 10 otherwise. The Y values are not continuos between those X regions, but gnuplot connects those discrete Y values by line. The set sample command makes those "connected parts" be as vertical as possible.  Broken functionsGnuplot ignores any mathematically undefined expressions like zero division (/0), as noted in Gnuplot FAQ. With this together with the ternary operator shown above, you can plot discontinuos functions. gnuplot> f(x) = (abs(x)>pi/2) ? sin(x+pi/2) : 0 gnuplot> g(x) = (abs(x)>pi/2) ? sin(x) : 1/0 gnuplot> set xrange [-2*pi:2*pi] gnuplot> set yrange [-1:1] gnuplot> plot g(x) w l lw 2,f(x) 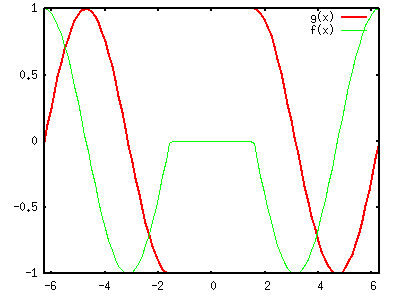
We comapre two sine functions, f(x) and g(x). f(x) is zero when |x| is smaller than 90 deg, while g(x) has a special expression, one over zero. I have moved f(x) slightly to see the difference of those two. LoopGnuplot has a reread and if commands. With those you can make a simple loop. The command reread re-reads the file again. When gnuplot finds this command in the control file, an endless-loop begins. To terminate the loop, use the if command, and you can determine the number of iteration. Let's make a simple animation by rotating a 3D plot. To rotate the drawing, change the view point angle from 0 to 360 with 5 degrees step. Firstly, make a "loop.plt" file whose content is as follows. This is a figure of function z=exp(-x*x)*erf(y). theta = theta + 10 set view 60, theta splot exp(-x*x)*erf(y) if(theta<360) reread An initial value of theta and the other setting are given outside the 'loop.plt' file. The endless loop begins when gnuplot reads the load "loot.plt" command. You can make an animated GIF with some tool, but usually you have to pay for it :-p gnuplot> set nokey gnuplot> set noxtics gnuplot> set noytics gnuplot> set noztics gnuplot> set border 0 gnuplot> set isosamples 40, 40 gnuplot> set hidden3d gnuplot> set xrange [ -5 : 5 ] gnuplot> set yrange [ -5 : 5 ] gnuplot> theta = 5 gnuplot> load "loop.plt" |