|
Since gnuplot has been ported to various operating systems, its
usage slightly depends on the platform. Here we describe an
introduction to gnuplot for the case of UNIX, X11. Basically its usage
is common to those systems, so that this tutorial may be helpful for
the other operating systems.
First of all, exec gnuplot. Gnuplot displays a banner and credit, then
shows a gnuplot command line prompt "gnuplot> ". Gnuplot is
a command line driven plotting tool. You give commands here to make your
figure.
% gnuplot

G N U P L O T
Version 4.0 patchlevel 0
last modified Thu Apr 15 14:44:22 CEST 2004
System: Linux 2.4.23

Copyright (C) 1986 - 1993, 1998, 2004
Thomas Williams, Colin Kelley and many others

This is gnuplot version 4.0.  Please refer to the documentation
for command syntax changes.  The old syntax will be accepted
throughout the 4.0 series, but all save files use the new syntax.

Type `help` to access the on-line reference manual.
The gnuplot FAQ is available from
http://www.gnuplot.info/faq/

Send comments and requests for help to
<[email protected]>
Send bugs, suggestions and mods to
<[email protected]>


Terminal type set to 'x11'
gnuplot>
At the "gnuplot> " prompt you can use the following commands:
Actually there are more commands which cannot be categorized into the items
above, so that it is hard to explain everything here. See gnuplot online help by
help command. Here we explain the simplest way to draw a graph with
gnuplot.
exit or quit command terminates gnuplot.
Once you quit gnuplot, all of setting you made will be lost. To save
the current setting, use save command followed by a file name in
which parameters and functions you defined are stored. The file name
is quoted by a single or double quotation. The file name is arbitrary,
but if the same name exists in the current
directory, gnuplot overwrites internal parameters in that file without
any warnings.
gnuplot> save "savefile.plt"
The saved file is a usual text file. You
can edit the contents with a text editor. To draw a graph again with
this file, use the load "savefile.plt" command at the
gnuplot command-line, or execute gnuplot and give the data-file name as
a command line option.
Inside gnuplot
gnuplot> load "savefile.plt"
Outside gnuplot (shell command line)
% gnuplot savefile.plt
The difference of those two methods is: with the load
command you go back to the gnuplot> command prompt after
gnuplot read the file, then you enter the usual interactive
mode. If you give the data-file name as a command line option (the
second case), gnuplot ends after it reads the file, and you come
back to shell. This is a batch
mode.
There are two basic commands to plot a graph, plot and
splot . The former is used for a 2-dimensional graph,
and the latter is for a 3-dim. Gnuplot makes a graph of any kinds
of functions or numerical data stored in a file. To plot a function,
use the plot/splot command with a range of X-axis
(or X and Y ranges for 3-dim. plot) and the function. You can omit
the range parameters. Here is an example of plotting y=sin(x),
which you may often see at many gnuplot tutorials.
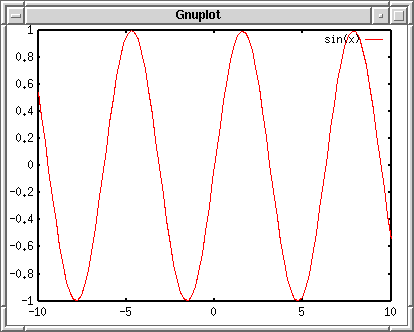
gnuplot> plot sin(x)
This is the 2-dimensional graph gnuplot generates. The frame is
drawn by a thick line, which is called “border”. The X and Y axes have
graduation called “major tics”, and numeric labels are written at the
tics location. The intervals between each major tic can be divided by
minor tics. You can draw names of X and Y axes. The X-axis name —
“xlabel” — is shown below the x-axis border, while the position of
“ylabel” depends on your terminal. If your terminal can rotate letters,
the 90-degree rotated ylabel should go to the left of y-axis, otherwise
it is shown at the top of y-axis.
If ranges of X and Y axes are not specified, gnuplot determines
appropriate values for those automatically. The example above you can
see the default X range which is -10 to +10, and the Y range was
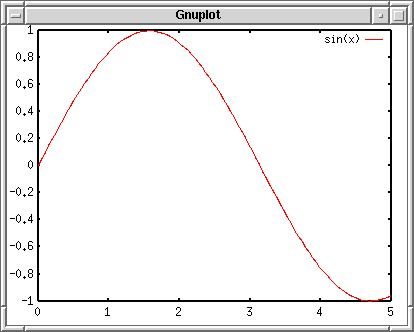
automatically determined. To set the X range 0 to 5, [0:5]
.
gnuplot> plot [0:5] sin(x)
There are a number of parameters which change your plot appearance.
You can change them by the set command. See online help.
gnuplot> help set
The `set` command can be used to sets _lots_ of options.  No screen is
drawn, however, until a `plot`, `splot`, or `replot` command is given.

The `show` command shows their settings;  `show all` shows all the
settings.

If a variable contains time/date data, `show` will display it according to
the format currently defined by `set timefmt`, even if that was not in effect
when the variable was initially defined.

Subtopics available for set:
angles         arrow          autoscale      bar
bmargin        border         boxwidth       clabel
clip           cntrparam      contour        data
dgrid3d        dummy          encoding       format
.....
zero           zeroaxis       zlabel         zmtics
zrange         ztics
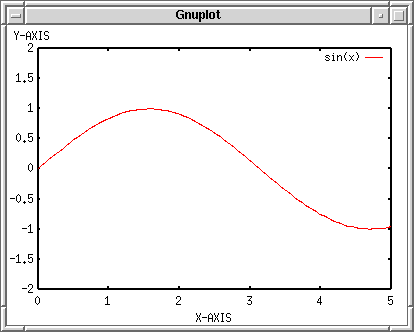
Here are several examples to change the parameters. Firstly
insert some text into the xlabel and ylabel. The text should be
quoted by a single or double quotation. Next, specify the range
of X and Y axes. As explained above the X range can be changed if
you specify that at plotting. Alternatively you can change them
by the “xrange” and “yrange” parameters.
gnuplot> set xlabel "X-AXIS"
gnuplot> set ylabel "Y-AXIS"
gnuplot> set xrange [0:5]
gnuplot> set yrange [-2:2]
gnuplot> plot sin(x)
If a terminal is not specified, gnuplot makes a graph on your
screen. The set terminal command changes the destination of
your plot into a postscript file or printer, etc. Gnuplot
produces a variety of graph by means of various drivers, so that it is
independent of the platforms (but quality of the drawing still depends
of the terminal). The terminals which your gnuplot can handle can be
displayed by the set terminal command.
gnuplot> set terminal

Available terminal types:
unknown  Unknown terminal type - not a plotting device
table  Dump ASCII table of X Y [Z] values to output
linux  Linux PC with (s)vgalib
....
tpic  TPIC -- LaTeX picture environment with tpic specials
pstricks  LaTeX picture environment with PSTricks macros
texdraw  LaTeX texdraw environment
mf  Metafont plotting standard

gnuplot> set terminal postscript
Terminal type set to 'postscript'
Options are 'landscape noenhanced monochrome dashed defaultplex "Helvetica" 14'
Gnuplot produces a graph in a Postscript format when set
terminal postscript command is given. If an output direction is
not specified, the produced Postscript data flow on your screen. The
set output command changes the destination of output.
gnuplot> set output "plot.ps"
gnuplot> plot sin(x)
You can escape to an interactive shell temporary in which any
shell commands can be used. To spawn a shell, use shell
command. To return to gnuplot, use exit . A single shell
command can be executed with the ! character at the beginning of the
command, like ! ls -a .
Gnuplot supports ‘pwd’ and ‘cd’ commands with which you can
display your working directory, or change the directory. The working
directory is your current directory when gnuplot is invoked. To change the
current directory, cd "../other/dir" . You need a quotation
mark.
You can use gnuplot as a simple calculator. To substitute a value
into a variable, just type “variable = value” at the gnuplot command
line. To see the value of variable, use print command.
gnuplot> a=10
gnuplot> print a
10
“Variable = expression” substitutes a calculated value into the
variable. Double precision is used for the calculation except for
integer.
gnuplot> a=1+2*sqrt(3)
gnuplot> print log(a)
1.49606798806764
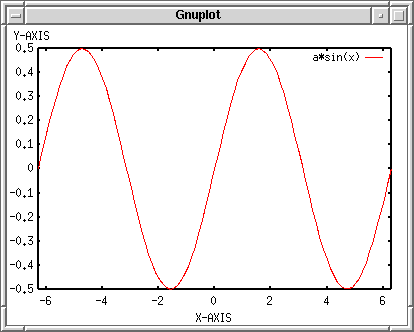
The defined variable can be used for the plot command.
Gnuplot holds the circular constant in “pi”. To draw a graph of a*sin(x)
from -2pi to +2pi, where a=0.5:
gnuplot> set xrange [-2*pi:2*pi]
gnuplot> a=0.5
gnuplot> plot a*sin(x)
You can define your own function. For example, to make a function
of f(x)=sin(x)*cos(x), it is defined as:
gnuplot> f(x)=sin(x)*cos(x)
The function defined above can be referred to as “f(x)”. You can
also include a user-defined variable in your function.
gnuplot> f(x)=a*sin(x)*cos(x)
This function contains a variable “a” which is defined by user,
and the function varies with this parameter.
|