gnuplot / plot (3E)
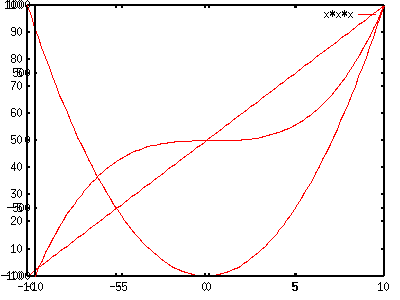
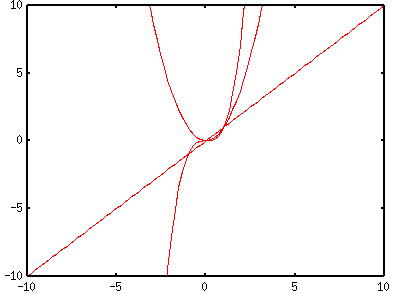
| not so FAQ | About 2-Dimensional Plot (No.3)I want to draw several figures on one drawing. There are two methods to make a drawing which contains several With the command set multiplot you enter the multi-plot gnuplot> set multiplot multiplot> plot x multiplot> plot x*x multiplot> plot x*x*x multiplot> set nomultiplot
Gnuplot determines the range, tics, and size of figure automatically gnuplot> set xrange [-10:10] gnuplot> set yrange [-10:10] gnuplot> set nokey gnuplot> set multiplot multiplot> plot x multiplot> plot x*x multiplot> plot x*x*x multiplot> set nomultiplot
Well, it’s much better. But such thing can be done by usual plotting As an example of multiplot, four Lissajous’ figures are plotted in gnuplot> set parametric dummy variable is t for curves, u/v for surfaces gnuplot> set noxtic gnuplot> set noytic gnuplot> set nokey gnuplot> set size square 0.3,0.3 gnuplot> set rmargin 0 gnuplot> set lmargin 0 gnuplot> set tmargin 0 gnuplot> set bmargin 0 gnuplot> set multiplot multiplot> set origin 0.1,0.1 multiplot> plot sin(3*t),cos(2*t) multiplot> set origin 0.1,0.5 multiplot> plot sin(3*t),cos(4*t) multiplot> set origin 0.5,0.1 multiplot> plot sin(5*t),cos(2*t) multiplot> set origin 0.5,0.5 multiplot> plot sin(5*t),cos(4*t) multiplot> set nomultiplot 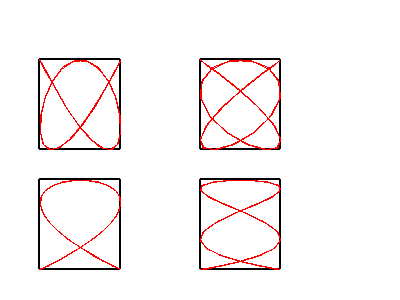 In order to make those figures the same size, the tics are erased by Usually it is difficult to adjust the position of each figure  I want to draw a grid at minor tics. The command set grid makes gnuplot> set mxtics 5 gnuplot> set mytics 5 gnuplot> set grid xtics ytics mxtics mytics This gives five grids at the minor tics between the major ones. You |